48th Congress of Controllers: Expert contributions from the Exhibitors 2024
Expert contributions of the Exhibitors 2024
Adapt1Solution / Article: FP&A and EPM - improving analyzes by crossing indicators
It is well known that Enterprise Performance Management (EPM) solutions are designed to eliminate data silos and automate forecast calculations between functional areas of the company.
In this way, for example, a sales forecast can directly influence production, which in turn influences labor requirements. The data generated (actual or predicted) is analyzed by the same reporting tools, simplifying both training and management.
A less frequently mentioned skill is the ability to analyze financial and non-financial metrics from different functional areas in a single report.
Isolated indicators provide a completely different interpretation when viewed together. For example, quantity to be produced has much greater significance when considered together with inventory and units sold. In addition, comparisons with a benchmark, another scenario or the previous year's result provide useful insights.
Whether it is a dashboard, cross-report, or reporting in Excel, a user should have the ability to select the indicators to display for their own analysis without having to worry about the underlying technical aspects.
How does a solution like Workday Adaptive Planning facilitate this type of analysis?
Common database
The only requirement is that the data has been loaded with a common database that applies to all relevant areas. In our example above, sales, inventory, and production must be based on the same item database, even if the data comes from different systems.
Other dimensions are of course added to enable specific analyzes for the respective area (item type, customer, production location, sales office, etc.).
Assign data on this basis
To obtain this data on the same database, it may be necessary to apply a mapping table that converts the source database into the shared database. This is made possible by the Load and Transform (ETL) functions.
The actual or forecasted data is stored with the same database according to its functional area. For example, salaries are loaded or recorded by individual, assets by asset type, and IT expenses by project. All are assigned at least at one level of the organizational hierarchy (unit or cost center) and per period.
Automatic linking
When creating a report, all that is required is to select the indicators and areas of analysis. The “linkage” between the data occurs automatically at the common analysis levels. Workday Adaptive Planning does not require any settings in the data model to combine all indicators into one report.
For example, as units are sold, stored, and produced, and the items are placed in the columns, the system displays the complete table without the need to define the join conditions, even though this data is likely stored in different areas of the database.
Calculations can also be made directly in the reports between these indicators (e.g. inventory / production) or compared to other forecast versions or the actual result. These calculations can of course be defined centrally, in advance, to provide a catalog of predefined KPIs.
What are the benefits for customers?
For a user, the advantage of this working mode is that they have no restrictions on the types of analyzes that they wants to carry out independently. All data is available and navigable without the intervention of administrators. Here are some examples of what you can do by yourself:
- combine a single report (purchases, sales, deliveries, sales, inventory location, etc.) (per item), and another that shows the total by a different area (country "Germany", color "Pink", etc.) (% Var N-1, Deliveries/Sales)
- understand the origin of the amounts
- or combine calculated indicators (monthly inventory, cumulative sales)
All technical considerations disappear; Access to relevant data is opened to a larger number of users, depending on their permissions. Everyone can conduct their own analysis, share it and draw informed conclusions from it.
About Adapt1Solution
Adapt1Solution is a consulting firm for finance departments.
We help you optimize and automate your closing and budget processes to increase your efficiency and accelerate decision-making. This through:
- A team of experts (former CFOs, controllers, ERP and EPM consultants such as SAP, Workday, PowerBI) to advise you
- An audit to find solutions together that suit you
- Implementation, training, maintenance and support
- Outsourced controlling
- Technological monitoring.

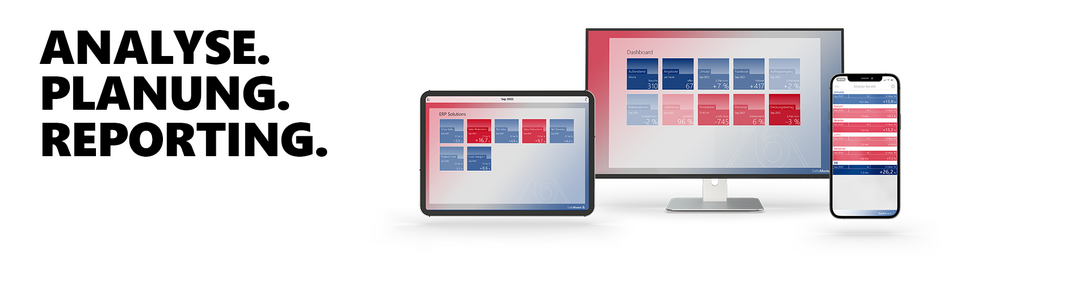
The first business intelligence application in 48 hours: zwissTEX, the Swabian manufacturer of high-tech textiles, has done it. With the help of Bissantz ERP solutions for SAP data, a comprehensive KPI landscape for controlling corporate finances was created - and integrated planning.
zwissTEX was looking for a software solution that transfers the data from SAP modules such as SD, FI, MM and PP into efficient reporting. The solution should map the financial and business goals with meaningful KPIs quickly and with little effort and measure the achievement of goals.
Trusting in Bissantz's performance promise, CEO and CFO Dr. Ulrike Neubauer made the project a top priority: “SAP landscapes can be cumbersome. I was skeptical as to whether something could really be added on top of that so quickly – but Bissantz kept the promise.” The linchpin of the solution is the Bissantz ERP Solutions, a tool for the automated creation of ready-to-use, packaged business intelligence systems. Bissantz delivered the first reporting application in just two days.
Soon analytical applications for the areas of logistics, sales and finance were created: from stock levels and ranges to product groups and bills of materials to contribution margins and profitability calculations. After only six months, the desired KPI landscape had taken on a concrete form - and can also be used on the smartphone with the Bissantz DeltaApp.
One of the first applications: the receivables monitor on the smartphone, with interactive access to perspectives such as debtor, product line, due date/dunning level and even the invoice items.
Parallel to the development of the KPI landscape, Bissantz zwissTEX supported the P&L planning: In the sense of an integrated planning, the cost planning in the nature of expense method was merged with the sales planning on sales objects. The specialist departments plan their cost centers and cost types in SAP, while Sales plans sales and turnover in Bissantz. The sales plan data for customers, articles or sales areas are in turn supplemented with the article calculation from SAP. The integrated planning profit and loss statement in Bissantz results in concrete targets for corporate management - the loop of planning, analysis and reporting is closed.
"From many years of experience, I am well aware of the possibilities and limitations of software in corporate management," explains Neubauer. "I was really surprised that such increases in information quality are possible in such a short time!"
READ THE COMPLETE ARTICLE HERE (PDF DOWNLOAD, GERMAN)
One of the first applications: the receivables monitor on the smartphone, with interactive access to perspectives such as debtor, product line, due date/dunning level and even the invoice items.
Parallel to the development of the KPI landscape, Bissantz zwissTEX supported the P&L planning: In the sense of an integrated planning, the cost planning in the nature of expense method was merged with the sales planning on sales objects. The specialist departments plan their cost centers and cost types in SAP, while Sales plans sales and turnover in Bissantz. The sales plan data for customers, articles or sales areas are in turn supplemented with the article calculation from SAP. The integrated planning profit and loss statement in Bissantz results in concrete targets for corporate management - the control loop of planning, analysis and reporting is closed.
"From many years of experience, I am well aware of the possibilities and limitations of software in corporate management," explains Neubauer. "I was really surprised that such increases in information quality are possible in such a short time!"
About Bissantz & Company
Bissantz & Company sees itself as a think tank for the application of artificial intelligence (AI) in management. The company was founded in 1996 and is still owner-managed and self-financed today - a true family business in the German-speaking business intelligence market. With our own basic research, the software is further developed in a scientifically sound and interdisciplinary manner. We combine insights from business administration, computer science, neurobiology, psychology, statistics and artificial intelligence. Our innovations are patented and have won numerous awards, including the Innovation Prize from the Gesellschaft für Informatik (GI) and the UX Design Award from the International Design Center Berlin (IDZ).

"It was important to us during the course of the project that the end user received the automation and logic that they needed so that they could carry out their planning as conveniently as possible"
Merle Schmidt-Brunn,
Senior Director Financial Analytics
Hapag-Lloyd AG
The company Hapag-Lloyd AG
Hapag-Lloyd is one of the largest liner shipping companies in the world with an EBIT of EUR 1.315 billion (2020). The company has a clear claim: “Number one for quality”. This claim is also reflected in the effort to accurately plan global business. Hapag-Lloyd is one of the leading providers in the Transatlantic, Middle East, Latin America and Intra-America trade areas and is characterized by one of the world's largest and most modern refrigerated container fleets. Using driver-based, integrated and globally distributed corporate planning, Hapag-Lloyd wants to adhere to the strategic goal of high reliability and quality and continuously develop further.
KEY FACTS
Industry: Transport & Logistics
Locations: 418 offices in 137 countries with headquarters in Hamburg
Employees: Around 13,900 worldwide
Software: Board
Advantages & benefits: Consistent solution in the company | Standardization of processes | Greater data transparency | Better management over data | A single environment for planning | Better and more detailed operational planning | Greater user-friendliness.
The challenges of the project
The challenge of integrated corporate planning at Hapag-Lloyd still lies in the closely interlinked partial planning within the group. Starting from the allocation of ship capacities to the planning of global sales volumes and the associated direct costs of the containers through to the general costs, the individual planning steps are very coordinated and interlinked. In the past, the existing solution in Excel and other tools led to a lot of manual and time-consuming effort and a high susceptibility to errors. Changes to assumptions and adjustments to planning could only be made at aggregate levels. A particular challenge in the project are the direct container-related costs (Cargo Related Cost, CRC), especially for the terminal and transport costs. In this planning, the costs are planned for each individual data point of a trip. The starting point is the upstream volume planning with a transport volume of 12.0 million TEU (standard containers) per year as well as 121 liner services that ensure fast and reliable connections between more than 600 ports on all continents worldwide. This partial planning generates a large amount of data points with high complexity due to the large combination logic and was therefore individually planned locally and regionally using standard costs in the past. However, with the previous approach, it was not possible to achieve better transparency in the creation and management of costs worldwide, as the costs incurred could not be directly assigned to the volumes and regional cost drivers.
"In the end, our goal is to develop a process in which all partial planning is mapped in the same way as it is carried out by the planner themselves. The tool should then take over the transition."
Merle Schmidt-Brunn
Senior Director Financial Analytics
Hapag-Lloyd AG
The implementation of the project
Hapag-Lloyd's objective was to set up an efficient solution for corporate planning that, in particular, integrates operational partial planning and accelerates the planning process. Employees should also be relieved and automation and flexibility should be increased. It was particularly important to Hapag-Lloyd that the new solution was extremely user-friendly and that the design of the planning masks could be designed in the look and feel of Hapag-Lloyd in order to achieve the highest possible buy-in from employees.
After reviewing and selecting providers, including carrying out a proof of concept, Hapag-Lloyd ultimately decided on the Board planning platform and celver as a partner for implementing the solution. “Our focus was on operational planning. Most tools on the market, however, only focus on planning financial packages. Our choice of Board and the experts from celver as implementation partners was not least because of the good cooperation in analytical projects with Qlik,” said Merle Schmidt-Brunn.
In the following weeks, the planning process was analyzed in workshops and the future planning process was defined. Hapag-Lloyd's solution now consists of holistic capacity, sales and cost planning with around 450 users. The annual budget planning, which results in a strategic five-year plan, serves as the basis for further updates as part of the forecasts carried out three to four times per year. The individual planning steps are connected to each other through a workflow and linked to each other through partial plan integration. Through this integration and the underlying calculation logic as well as the integration of historical data, planners can usually use suggested values as part of their plan inputs. An important part of the project was data connection and preparation. Here, various preliminary systems with different levels of detail had to first be harmonized and merged in order to ultimately obtain a detailed planning solution including the required actual data. During the course of the project it became clear once again that an agile approach, retrospectives and good collaboration bring significant advantages on complex topics.
The new planning of Cargo Related Costs (CRC), which occupies a special place in integrated corporate planning, uses the worldwide planned container volumes and their distribution on the routes as input. The modeling of this network planning enables Hapag-Lloyd to adjust and simulate costs using a wide variety of parameters and thus to determine global or local effects on the routes and in the ports.
The use
The goal of standardizing the processes and creating a “one-system-for-planning” environment was achieved in the project. This ensured global data transparency (single point of truth) and management over the data at all times. The project has already come closer to the goal of reducing global planning by two weeks, but here too, further expansion stages and refinements in the planning process are necessary in order to achieve “pace and perfection”. The new planning environment, with its focus on operational planning, also has a direct impact on end users beyond the actual planning. Since the operational logic and, above all, the detailing of the data is close to the daily business of the planners, the information is also used for operational management using plan/actual comparisons.
About Celver AG
We have been implementing complex planning and analysis solutions based on smart data architectures for customers of a wide range of industries and sizes for over 20 years.
Our goal: to build tailor-made solutions together that form the basis for data-driven decisions. Our certified experts provide support with innovative concepts and technologies, from technical advice to process definition, complete implementation and integration into the system landscape, right through to training, roll-out and change management.
As a technology-independent consulting company, we are a member of the UNITY Innovation Alliance.
In an increasingly volatile and unpredictable business world, companies are faced with the challenge of being able to react quickly and flexibly to changes. The key lies in the ability to obtain precise and timely information that enables informed decisions. Ad hoc reporting is an indispensable controlling tool. It enables the creation of tailored queries for specific questions and is particularly valuable for effectively responding to short-term requests from management, stakeholders or regulatory bodies.
BASICS OF AD HOC REPORTING
Ad hoc reporting plays a central role in modern controlling. It enables companies to react flexibly and quickly to individual information needs. Unlike standardized reports, ad hoc reporting provides tailored analysis for unforeseen or specific requests and supports data-driven decision making.
CHALLENGES IN AD HOC REPORTING
However, conducting ad hoc reporting can also pose challenges:
- Time-intensive data collection: Compiling and analyzing data manually can take significant time.
- High demands on data quality and integration: Ensuring high data quality and the efficient integration of data are essential.
- Complexity of data analysis: The need to effectively analyze and interpret complex data requires specialized skills and tools.
EXAMPLE: Analyzing the impact of raw material price fluctuations and supply chain bottlenecks on production costs
Initial situation
A manufacturing company faces two parallel challenges: significant fluctuations in the prices of key raw materials and supply chain bottlenecks that affect the availability of those raw materials. This situation threatens production stability and could lead to significant cost increases. In order to respond adequately, management needs a quick and precise analysis of the current situation and the potential impact on production costs.
Challenge
The required data is scattered across various internal departments and external suppliers. In addition, current market data on raw material prices must be taken into account. Manual collection and consolidation of this data is required to perform a comprehensive analysis of the impact on production costs.
Solution
- Data collection: colea is used to provide a central platform for collecting relevant data. This includes current and forecast raw material prices, information about existing and potential supply chain shortages, and details about alternative suppliers and raw materials.
- Structured data entry: Appropriate input masks are created and made available to the relevant internal and external stakeholders to ensure standardized data collection. This structure makes it easier to capture complex and diverse information.
- Preparation for external analysis: Although colea itself does not offer specific analysis functionality for this scenario, the platform supports the organization and preparation of the collected data for further analysis. By providing a structured and consolidated database, the company can use external tools such as Excel or specialized analytics software such as Power-BI or Qlik to model and evaluate the impact on production costs.
- Development of recommendations for action: Based on the analyzes carried out, strategies can be developed to minimize the negative effects on production costs.
Result
By effectively leveraging colea for rapid data collection and consolidation, the company is able to make informed decisions to address the challenges caused by raw material price fluctuations and supply chain shortages. This helps control production costs and maintain production despite external uncertainties.
About Colea
colea offers direct solutions to the challenges of ad hoc reporting. As a specialized SaaS platform, colea enables:
- Increase efficiency: By providing an intuitive interface and the ability to quickly create query templates, colea significantly reduces the time spent on data entry. The platform also makes it easier to prepare data for analysis with external tools, making the overall process more efficient.
- Ensuring data quality: Standardized recording processes and validation rules in colea ensure high data quality and consistency. This is particularly important in order to be able to make reliable decisions based on the data collected.
- Flexibility in data collection: Colea allows users to easily collect data from and combine it in a consistent format. This flexibility helps companies create a comprehensive database for analysis, even without a direct connection to various sources.
- Facilitated collaboration: Through the central platform, colea promotes collaboration between teams and departments and the flow of information between teams and geographical locations.


The Staatliche Porzellan-Manufaktur Meissen GmbH realized a comprehensive digitalization project together with Comarch. Meissen, one of the internationally best-known luxury manufacturers, chose Comarch as its software service provider. Comarch ERP Enterprise and Comarch Financials Enterprise were introduced within eight months. Most recently, Meissen started implementing the document management system Comarch DMS.
The customer
Meissen, the oldest porcelain manufacturer and registered brand in Europe, draws on over 300 years of styles and creates new designs using the finest craftsmanship. Every Meissen creation today becomes, so to speak, a modern interpretation of European art and cultural history. Modern opulence conquers interiors in the zeitgeist. Fine things for the table, masterpieces, figures, pieces of jewelry and home deco porcelain delight people all over the world who appreciate the luxury of sustainable production and exquisite handcraft. Meissen porcelain can be recognized by the crossed swords signet and is a testament to the quality of the manufacture. In 1710, Meissen invented European porcelain. Owned by the Free State of Saxony, it is one hundred percent manufactured in Germany.
Data & Facts
Name Staatliche Porzellan-Manufaktur Meissen GmbH
Industry Porcelain, luxury goods industry
Headquarters Meißen
Project progress
Andrea Zanke, ERP Implementation Project Manager at Staatliche Porzellan-Manufaktur Meissen GmbH, explains how the company switched from a highly customized previous solution to the integrated Comarch ERP Enterprise system. The goal of this extensive project was to stay as close to the standard as possible and thus be able to map the processes surrounding a highly individualized product.
Initial situation and motivation for the ERP project
The starting point for the ERP project at Meissen was one typical of medium-sized companies. There was a relatively heterogeneous IT system landscape that had grown over the years and consisted of a mix of standard and proprietary software. The individual systems required a lot of effort to maintain the interfaces. The business processes sometimes ran beyond the system boundaries, which made it difficult to conduct business efficiently.
Goal
The introduction of the new ERP Systems was about bundling a wide variety of IT systems and mapping the business processes in an integrated IT system with integrated end-to-end processes. The overarching goal was to stay as close to the standard as possible and thus be able to map the processes surrounding a highly individualized product.
“The manufacturer has set out to optimize its processes related to craftsmanship. While the craftsmanship and handwork in the production of porcelain are our unique selling point, we wanted to put the management and administration of our processes on an efficient footing,” says Andrea Zanke, ERP Implementation Project Manager | State Porcelain Manufactory Meissen GmbH.
Results
Greater data transparency in the area of finance & controlling
The finance and controlling area benefits most from the integration of the systems, as this is where most of the data from all areas comes together. The Comarch ERP system proved to be very performant and flexible. The many functions in the area of evaluations are particularly pleasing. The cockpits are very flexible and offer a high degree of data transparency.
Centralization and standardization of procurement processes
From a purchasing perspective, the new ERP system should help centralize and standardize procurement processes. It was also important to map the various business processes (tourism, production, direct & indirect purchasing). Furthermore, Comarch DMS, a new document management system, was introduced, which brings additional advantages:
- automated recording of receipts (automatic reading of PDF invoices and offers)
- an automatic certified filing
- The very good workflow system leads to long-term relief from additional work and avoidance of errors
About Comarch Financials Enterprise
The modern, internet-based accounting solution Comarch Financials Enterprise is used in many companies in Germany, Austria and Switzerland as well as internationally. As a stand-alone solution for financial accounting, controlling and asset accounting, Comarch Financials Enterprise forms an integrated platform for a company-wide customized application. As an integral part of Comarch ERP Enterprise, it enables full transparency in all areas of the company and is modularly expandable. The strengths of the accounting software include its ease of use, an open system architecture for data exchange with third-party systems, and many years of experience with a four-digit number of installations of Comarch Financials products for customers such as Victorinox, Weitkowitz and KiK.


Authors: Mike Schulze / Felix Broßmann / Bernd Wallraff
The launch of ChatGPT (Generative Pre-trained Transformer) in late 2022 sparked a wave of interest in generative artificial intelligence (AI). It is a chatbot that uses AI to communicate with users via text-based messages. In response to user input, the user is able to generate specific texts. Within days, millions of users around the world experimenting with this newly available technology had discovered and shared countless ways to use it effectively. In the weeks and months that followed, companies also tried to keep up with this immense development. Some companies have already taken a formal approach and formed special teams to investigate how generative AI can be used to benefit business models or companies and improve efficiency in the company.
What is generative AI?
Generative AI refers to machine learning models that can, for example, generate texts, images, audio sequences or synthetic data by imitating human-like language patterns and structures. These models are trained on various internet texts and are incredibly creative in generating stories, poems and subject-related articles. In addition, they can perform various tasks, answer questions, and provide detailed explanations, making them valuable tools for a variety of applications.
There are generative AI tools for different modalities, such as text, images, music, code and voices. Examples of different AI content generators include the following:
- Text generation tools such as ChatGPT, Jasper, AI-Writer, Bard and Lex.
- Image generation tools include Dall-E 3, Midjourney and Stable Diffusion.
- Music creation tools: Amper, Dadabots and MuseNet.
- Code generation tools: CodeStarter, Codex, GitHub Copilot and Tabnine
- Speech synthesis tools include Descript, Listnr and Podcast.ai.
Basic capabilities of generative AI
Generative AI can be used extensively in many areas along the company value chain. It can make existing content easier to interpret and understand and automatically create new content. Some of the fundamental capabilities and resulting benefits of using generative AI are:
- Automating the manual content creation process,
- Reducing the effort required to respond to e-mails,
- Improving the response to specific technical queries,
- Summarizing complex information,
- Simplifying the process of creating content in a specific style.
Opportunities for controlling and finance
Some specific use cases have already been discussed for controlling and finance areas:
Identification and assessment of risks: Generative AI models can process large amounts of text information and analyze and evaluate them in relation to different risk categories. They can answer questions and provide personalized recommendations. This technology allows financial professionals to provide better customer service and streamline communications.
Financial analysis and forecasting: Generative AI models are ideal for analyzing finance-related data such as financial statements, balance sheets, and profit and loss statements. You are able to identify trends, predict results or create detailed financial analysis.
Fraud detection: By analyzing historical transaction data, generative AI models can detect patterns and highlight potential anomalies that indicate fraudulent activity. By using AI-powered fraud detection, companies can improve their security measures and protect their assets.
Extracting data from financial documents: Generative AI can automate the extraction of specific data from various financial documents such as invoices, contracts, and regulatory filings. This automation reduces manual effort, improves accuracy and accelerates processes, which ultimately increases efficiency in the controlling and finance areas.
Creation of financial reports: Generative AI models can automate the creation of financial reports, saving time and effort for controlling. By using natural language features, these models can also produce annotated reports that enable better decision making.
Limits and risks
Although generative AI offers exciting and diverse possibilities, there are also limitations and risks. Data protection and future regulatory requirements regarding the use of AI are particularly important.
Data protection: Ensuring data protection is crucial in the age of regulations such as the EU General Data Protection Regulation (GDPR). Companies must handle customer data responsibly and comply with data protection regulations to avoid legal consequences.
Future regulatory landscape: New regulations relating to AI are currently being coordinated at the European level. For example, the European Union's Artificial Intelligence (AI) Act aims to reduce the risks associated with the use of AI by requiring developers to test their systems, document use and take security measures. The effects of these legislative initiatives cannot yet be conclusively assessed - what is certain is that there will be restrictions in the usability of non-European solutions if they do not meet the then applicable regulatory requirements.
Notes on practical application in a corporate context
Despite the risks outlined, generative AI tools can already be used in company practice in a comparatively legally secure manner, provided that data protection and the protection of business secrets are taken into account.
Use of non-European service providers: The technologies of non-European AI providers such as OpenAI (the company behind ChatGPT) should only be used in a corporate context if it is ensured that the data entered is both data protection compliant and does not represent any business secrets. In this regard, it is not problematic to use it to generate marketing and information materials. In the context of controlling and financial processes, however, it will only be possible to find use cases that meet these requirements to a limited extent. In any case, technical security should be used, for example by checking the input data before sending it from your own IT infrastructure, which is relatively easy to implement.
Use of GDPR-compliant AI models: The German company Aleph Alpha is focused on providing explainable and trustworthy AI models that are GDPR-compliant. The use of these models ensures compliance with the GDPR and offers flexibility in possible uses. In this case too, you should refrain from entering data that represents trade secrets. For such use cases, Aleph Alpha offers the option of integrating the language model completely independently into your company's infrastructure. This ensures that the data does not leave your own servers.
Use of open source models: To protect trade secrets and avoid data leaks, companies can use open source models that can be customized and also installed on the company's own infrastructure. This approach allows companies to maintain control over their protected information while benefiting from generative AI capabilities. For example, Bosch would like to provide its own BoschGPT for its employees by the end of the year. Other companies such as dm, Samsung, McKinsey and SKAD are also working on such solutions. The basis for BoschGPT is Bosch's in-house database. This procedure makes it possible to use current company data for the results created. This means that the system cannot currently be directly connected to solutions such as ChatGPT or Bard, otherwise data could leak. For this reason, the capabilities of these applications, despite immense improvements, do not yet come close to proprietary solutions such as ChatGPT or Bard. However, the rapid development of the past few months suggests that this will be the case in the medium term.
How do you achieve good results with generative AI?
Link statements, questions and instructions: In order to achieve good results, you have to give AI systems like ChatGPT instructions that are as accurate as possible. A crucial aspect that significantly influences the efficiency and accuracy of the results is so-called prompting. A prompt represents an input that is provided to the respective model to produce a response or prediction. This input can take various forms to direct the output in the desired direction. For example, questions can be asked, specific instructions can be given, or a chain of statements, questions or instructions can be strung together.
Examples of prompts
- How many inhabitants does the capital of Denmark have?
- Name the five most commonly practiced sports in Europe.
- Is there a difference between “causality” and “correlation”? If so, please explain it using examples.
An effective prompt should generally be formulated as clearly and precisely as possible. Instead of “What can you do with ChatGPT in controlling?” the query leads to “I am planning to use ChatGPT in the area of analyzing business data for a medium-sized company. What areas of application are there?" leads to significantly more specific results. The structure of the prompt gives the AI models a clear context and direction, which ultimately leads to more focused and relevant answers.
Sample Prompt Construction: Creating an effective prompt is an essential step to getting accurate and nuanced answers from a generative AI. Here is a simple guide that walks you through the process step by step:
1. Facts: You should start with a clear definition of the central topic or question. In this step, it is important to understand and convey the exact context of the question. For example, a request could be: “I would like to develop a concept for optimizing cost center accounting in my company.” This gives the AI a clear starting point that allows it to focus on the specific details that are relevant to optimizing cost center accounting.
2. Framework conditions and restrictions: The next step is to determine the specific framework conditions and restrictions that the AI should take into account when answering the query. This could e.g. include paying particular attention to certain departments or business areas. By precisely defining these parameters, the AI can create a response that is tailored to the exact requirements.
3. Format: Finally, the format in which the answer should be presented is defined. This could be a textual representation that describes the optimized cost center accounting processes in detail. Clearly stating the desired format helps the AI structure the response in a way that is easy to understand and interpret.
Example of a prompt in this simplified design:
- “I would like to develop a concept for optimizing cost center accounting in my company (fact).
- Pay particular attention to the sales and production departments to ensure efficient allocation of costs (framework conditions and restrictions).
- Present the results in a textual representation that describes the optimized cost center accounting processes in detail (format).”
Advanced Techniques: The basics needed to create effective prompts are relatively easy to learn. At the same time, there are many advanced techniques in the field of prompt engineering that make it possible to further refine and optimize the output of generative language models.
Some of these techniques are based on the idea of "training" the model with different amounts of information or examples before producing an answer. These include approaches such as:
Zero Shot Prompting (standard case): In this case, the model is asked about a topic without prior specific examples or information. Example: “Explain the use of the balanced scorecard in controlling.”
One Shot Prompting: The model receives a single, relevant example before answering a query. Example: “Just as a company uses key performance indicators (KPIs) to measure success, how might an educational institution measure its performance?”
Few Shot Prompting: The model is provided with several relevant examples to prepare it for a specific query. Example: “A company might use a SWOT analysis to evaluate its strategic position. A sales team might use CRM software to manage customer relationships. How could an HR department use big data?”
Another example of advanced approaches is the so-called “chain of thoughts” approach. This is a method in which a language model is encouraged to explain its thinking or solution step by step when solving a task. The idea is that by showing examples that explain the thought process, the model learns to show its own thought process when answering questions. This type of prompting can make the model's answers more accurate because it is forced to think about each step of its response, which can be particularly helpful for complex tasks. This representation also makes the results of the AI more transparent for you.
In addition, a number of advanced prompt techniques such as Tree-of-Thoughts (https://arxiv.org/abs/2305.10601) or Graph-of-Thoughts (https://arxiv.org/abs/2305.16582) are currently being developed, which use different reflection techniques to improve the outputs generated by language models many times over.
Overall, it can be said that choosing the right prompt technique depends heavily on the specific request and the desired result. The only thing that helps here is the continuous practice of different techniques by the users.
Summary and conclusion
Generative artificial intelligence, such as ChatGPT or similar models, has transformative potential for controlling and financial areas in companies. Applications include conversational finance, financial analysis and forecasting, fraud detection, document analysis and financial reporting. However, companies need to keep an eye on data protection, regulatory compliance and changing legal environments. By using solutions like ChatGPT, collaborating with AI providers specializing in data security, using GDPR-compliant AI models, and adapting open source models, companies can maximize the power of generative AI while minimizing risks and comply with regulatory requirements. It will also be crucial for companies to continuously stay up to date with the latest developments in this extremely dynamically developing field and to introduce responsible AI practices within the company in order to be able to use generative AI effectively.
About the Controller Magazin
Controller Magazin provides you with first-class specialist information for your day-to-day controller practice! Every 2 months you can find out what the latest developments are, which topics concern your colleagues and which practical tools you can use to make your daily work much easier.
Language is German.
To the Controller Magazin page
As experienced pioneers and mountaineers, we accompany our summiteers (customers) in strategic advice on Microsoft Power BI as a new and modern analysis platform.
We support this holistic process with our basecamp process model, which focuses on three pillars (technical, visual and cultural) and thus generates high added value for our customers.
We firmly believe that tool security and data literacy in today's world provide our customers with the competitive edge that companies need. We offer virtual and free Power BI basic training every month.
In addition, we support the replacement of old BI systems and offer transparency for our customers through fixed prices.
www.datenpioniere.de/erfolgsgeschichten
About DataPioniere GmbH
From strategic Microsoft Power BI consulting to a company-wide analysis platform. That is the mission of the data pioneers.
As experienced pioneers in this field, we support over 40+ customers every year in setting up their new data & analysis platform based on Microsoft technology. With the help of our standardized and methodical basecamp process model, we create clarity and a clear view of your company data for our customers.
This means our customers never have to make bad decisions again.
“Carthago”: The name stands throughout Europe for premium motorhomes with an exceptional sense of space. When Karl-Heinz Schuler founded the company Carthago in Ravensburg in 1979 with individual conversions of panel vans according to customer requirements, he had the premium segment in the motorhome market in mind right from the start. Today, Carthago Reisemobilbau GmbH is one of the leading providers in Europe. The group of companies has operated from its headquarters in Aulendorf, Upper Swabia, since 2013.
In “Carthago City”, the owner-managed family business not only operates one of the most modern motorhome production facilities in Europe, including a sales exhibition, but also offers numerous rental vehicles. Around 1,400 people are employed here and at the Odranci production site in Slovenia, generating annual sales of around 390 million euros (2021).
The trend towards “traveling on four wheels in your own living space” was somewhat slowed down by delivery bottlenecks at the Upper Swabian premium manufacturer. Nevertheless, the Carthago Group remains on a growth path, which is underlined by the newly opened second production site in Slovenia.
Satisfy the need to catch up
The focus of Carthago's business activities has been the development and production of premium class motorhomes for over 40 years. Great importance is placed on comfort, safety and longevity, as well as on continually improving and refining the vehicles.
In view of the rapid growth, the Carthago group of companies was faced with changing planning and reporting requirements at the beginning of the 2020s, when the tools previously used - Excel and IBM Cognos Analytics - could no longer adequately reflect. Analyzes should be completed more quickly and reports should be available on a daily basis. “We had a certain amount of catching up to do,” says Christian Staud, Head of Controlling at Carthago. A new solution with BI functionality should help here.
The selection was easy thanks to existing internal system applications and experience. Carthago should make progress very quickly with the advice and technology of the service provider elKomSolutions GmbH from Tuttlingen. “I wasn’t part of the selection process yet, but I can only confirm this,” explains the qualified mathematician who has worked at Carthago since June 2019. At the turn of the year 2018/19, Carthago put the elKom solution into operation.
Prototypes simplify the introduction and operation of the software
“When I came to Carthago, the software was technically implemented but not yet fully rolled out. The roll-out then went very quickly, which, says Staud, was “particularly due to the methodology of elKomSolutions”. Developing prototypes that then serve as a template for operations leads to quick visibility and rapid implementation success. Staud also attributes this to the software, which is “completely uncomplicated to use and runs stably”. That's why there is very little need for support.
elKomBI is now in use based on the OLAP database IBM Planning Analytics TM1. Carthago uses the solution for reporting and planning. Staud emphasizes that a particular advantage is that the controlling department can operate and further develop the solution almost independently of internal IT or external consultants. IBM Cognos TM 1 carries out evaluations of large amounts of data in a very short time and is easy to use.
The BI function supports the analysis of more complex data sets and their condensation for reports. Thanks to the Excel integration, controlling can quickly and easily design reports for the various recipient groups in the company. TM1's technology then enables access via the web, so that report recipients can log in via the Internet and access their reports on a daily basis.
One keystroke instead of endless Excel evaluations
Time savings, convenient and customizable evaluations and a better overview of a wide range of key figures are the main advantages that Carthago derives from the solution from elKomSolutions. The cost center reporting goes to around 65 report recipients. Before introducing the software, Carthago had to invest at least half a year to create evaluations for all of them on their respective budget trends. Now all you need to do is press a button to send your specific report to all report recipients.
This “very great strength” also affects other specialist areas. Similar to car manufacturers, Carthago customers can configure their motorhome. A large selection of product variants is available. With the BI tool from elKomSolutions, these can be analyzed over several years and thousands of customer orders in a matter of seconds - in order to better understand customer needs and, for example, to be taken into account for future product development.
elKomBI has significantly accelerated the evaluation of detailed information from the product range over many years. elkomBI creates these reports in seconds: “We now run a data set with 20 million individual pieces of data through the software and receive the analyzes in a few seconds,” notes Staud. That really impressed him as a controller. Completely automated, the software delivers such reports not only monthly, but daily.
Outlook: even more visibility, even more functionality
“We have now rolled out the reporting to the first and second management levels for the purpose of economic management. This greatly benefits the first level of management, who have access to consistent data. The same applies to the second management level, which receives the information it needs at the push of a button,” says Staud. The Carthago Group's controlling department is constantly developing the analyzes and reports “because the benefits are so great”. After the cost center reporting and the managing director reporting, there are now individual reports for the specialist departments, for sales, production and others such as: purchasing controlling. Head of Controlling Staud summarizes: “In the area of controlling, we have catapulted ourselves into a different era. When we commissioned our new plant in Slovenia, we were particularly able to benefit from the scalability. In the Excel world we would probably have had to hire significantly more staff. Now, all you need is powerful BI software.”
elKomSolutions: Integration as the key to success
elKomSolutions GmbH has pursued an integrated approach since it was founded in 1997. From the outset, it has relied on IBM Planning Analytics TM1 database technology and connects previously separate departments in the company with a uniform database based on OLAP technology. The basic idea is to make work as easy as possible for customers from small and medium-sized businesses, but also large corporations. But meeting the customer where they are currently traveling also means starting from Microsoft Excel. 95 percent of companies continue to use the versatile tool for controlling, sales and production planning, group consolidation and reporting. However, there are limits, be it in terms of the efficiency, speed and transparency of these processes, or in their integration.
For this reason, elKomSolutions has created modular software components for the areas of business intelligence (BI), corporate planning and group consolidation - and is constantly developing them further. elKomBI, elKomPLAN and elKomKONS are independent solutions for the individual sub-areas. Connected via OLAP technology, they integrate seamlessly and offer all departments direct access to all data. What they have in common is extremely fast data processing, even with extra large volumes, openness to any database of operational systems, etc. from the ERP and financial accounting environment, the high level of flexibility and adaptability - without external employees having to do this - as well as a uniform front end for controlling, planning and consolidation. And of course Excel can still be used, which reduces the training effort for departments that use Excel, for example for data entry.
The solutions form a holistic, modular software platform for analysis, reporting, planning and consolidation, in short for integrated results and financial management. Through integration into the operational world, classic performance management becomes identical in terms of approach, methodology and database. In other words: planning, forecasting, consolidation, but also actual reporting are always from a single source.
About elKomSolutions
Software solutions for BI, planning and consolidation!
As a specialized IT service provider, we concentrate on the development, introduction and support of software solutions for business intelligence, corporate planning and group consolidation based on IBM Planning Analytics TM1.
elKomSolutions offers you comprehensive services from the conception and development of your individual software solutions with IBM Planning Analytics TM1 to user training and support after the end of the project.
3 solutions – 1 concept – 1 database. IBM Planning Analytics TM1
Thanks to consistent OLAP technology (IBM Planning Analytics TM1), dynamic Excel connection and seamless web integration, you benefit from maximum flexibility.
Our software solutions can be used as individual modules or as an integrated overall solution for business intelligence, corporate planning and group consolidation.
BACKGROUND
Lufthansa CityLine was looking for an alternative to the predominantly static reporting system based on SAP BW. In addition, the airline's controlling wanted to optimize cost planning specifically with regard to the degree of automation, reliability and transparency of the planning values.
CHALLENGE
IT point of view:
- There was no BI self-service for the specialist departments, so many individual steps were implemented manually.
- Report development was slow and took an enormous amount of time.
- Maintaining the BI system environment was very tedious and had to be simplified.
Controlling:
- The SAP ERP based cost planning process had to be replaced because it was not efficient enough and cost a lot of capacity.
- The planning had to be created from various data sources.
- A system-supported target and actual cost object calculation could only be created with great effort.
LUFTHANSA CITYLINE: SOLUTION WITH FIPLANA
What spoke in favor of the solution with Fiplana were the ability to function both as a front end and to cover the ETL process in the back end, as well as the high flexibility in dealing with source systems and analyzes as well as the self-service functions. Lufthansa uses Qlik Sense as a source system for its data. Fiplana makes it possible to edit data directly in the Qlik interface or capture new data in Qlik Sense. Fiplana also contains complex planning functionalities, such as the transfer of reference data or the implementation of planning based on real historical data. In order to take relevant developments into account and bridge the gap between the planned values created in the previous year and the current actual values, a rolling forecast should also be presented.
Thomas Bayer and Patrick Lowski, co-project managers Controlling2.0@CLH at Lufthansa CityLine:
“We had previously planned the “anticipated actual” (VI) – as we call the forecast – in Excel and reported it to the group. We always had to manually book the expected actual cost items individually into the system or import them via uploads. We wanted to automate this input process instead. INFORM DataLab then implemented the budget planning, planned cost object accounting and VI processes in an agile process and also worked one or two night shifts in order, for example, to develop an algorithm for calculating the expected actual value.”
In the future, airlines will increasingly be able to use a BI system to see exactly which engine or aircraft causes which costs. “Actual cost accounting will bring us significant added value so that we can then derive statements at cost object level during the year and identify the differences to the planned rates. All of this is only possible because of Fiplana.”
ADDED VALUE THROUGH THE USE OF FIPLANA
- Time savings by eliminating the need to manually enter planning data
- Optimized planning, management and information supply
- Relieving the burden on IT
Time to Value:
6 months until the first applications go live
Return on Investment:
1 day instead of 1.5 days monthly effort for creating the forecast and agile reports using the self-service BI approach
About Fiplana / INFORM DataLab
Fiplana, the new cloud-based platform solution from INFORM DataLab, enables intelligent corporate planning and offers comprehensive support in corporate performance management (CPM). By creating reports and dashboards, users gain quick insights into financial data, track financial planning performance, and identify trends. As a single source of truth for planning and analysis, Fiplana integrates real-time data, promotes team and interdepartmental collaboration, and simulates business cases and scenarios to enable data-driven and sustainable business decisions.
The INFORM DataLab offers comprehensive full-service consulting along the entire data value chain, supports customers in data-based decisions and accompanies them through digital transformation. The DataLab experts use individually tailored solution approaches, from advising on sustainable data strategies to implementing efficient data analysis and data management solutions.

ICV Note: Participants of the 48th Congress of Controllers will receive the specialist reading on site in Munich free of charge / From May 1, 2024, this latest edition from the ICV series will be available here in the ICV Online Shop!

By Prof. Dr. Ronald Gleich
Professor for Management Practice & Control at the Frankfurt School of Finance and Management / Heaf of the Centre for Performance Management & Controlling there
Summary
Sales is one of the core functions in the company and should be intensively supported by controlling. This article describes which logics exist in sales controlling and what the most important starting points are for making sales performance transparent and increasing it from the controlling side. Finally, the insights that can be drawn from current studies are shown.
Sales controlling process model
If you look at the controlling process model of the International Group of Controlling (IGC), then sales controlling, analogous to production or personnel controlling, is a special approach for a function of the company's value chain. The IGC understands sales controlling in detail as “...the targeted management of strategic and operational sales activities in order to ensure the effectiveness and efficiency of the sales area” (IGC 2017, p. 68).
As Fig. 1 shows, sales controlling includes sub-processes such as:
- Carrying out sales cost accounting (e.g. with instruments such as product results accounting, contribution margin accounting or order costing),
- Strategic and operational planning activities,
- Sales reporting with sales-relevant control information (usually various sales-related key figures) as well
- Sales-related risk controlling.
From an organizational point of view, it makes sense to deal with sales processes and their performance as part of sales controlling. This is the subject of both sales cost accounting and sales reporting. This involves analyzing cost and performance characteristics such as:
- Process lead times,
- Process costs,
- Process quality,
- Waiting times,
- Intra-process and cross-process coordination problems,
- Internal and cross-process duplication of work,
- Value-destroying activities,
- Ineffective or value-added activities or
- Bug fixes
About the Frankfurt School of Finance & Management
The Frankfurt School of Finance & Management is one of the largest and most research-intensive economics faculties in Germany. It is one of a small circle of “Triple Crown” accredited universities of excellence. The coveted triple accreditation (AACSB, AMBA, EQUIS) is an international seal of quality and stands above all for the high quality of teaching and studies. The Frankfurt School specializes in finance, economics and management topics and offers bachelor's, master's, MBA and doctoral programs as well as further education and training (executive education) through seminars, certificate programs and tailor-made in-house training for specialist and Management. The Frankfurt School regularly achieves top positions in renowned university rankings.
The Center for Performance Management & Controlling (CPMC) is a central contact point for companies from different industries for fundamental and application-oriented research in the area of controlling - geared towards current issues that are company- or industry-specific or industry-independent.

Initial situation
Business Intelligence (BI) modernization has great potential for benefits on a strategic, tactical and operational level. The existing BI solutions in companies are often not geared towards agility and sustainability, which is why they cannot adapt to and grow with constantly changing requirements.
From conversations with experts and customers who have actively dealt with this topic, we came to the conclusion that BI would have to function like a kind of “data factory”: a flexible, automated and sustainable system where users can obtain relevant data products without having to put these together or verify them themselves.
Dimensions of BI modernization
As a result, a model was developed in a workshop with external experts that characterizes the dimensions of BI in their “outdated” and “modern” forms. Below is a list of the dimensions with a partial outlook on the “modern” form:
- Strategic importance: Data is viewed as a company asset
- Data-driven management: Actions are triggered by data products
- Financing: Long-term and recurring investments are made in BI
- Project approach / time-to-value: Agile, BI-specific development processes
- BI organization & managment: Established BI organization and defined processes
- Data literacy / transfer of know-how: users receive training and further education
- Technology / suppliers / service providers selection: Users are involved in the selection
- Platform location / scaling: Scalable (cloud) solutions are in use
- Degree of automation: Processes are (partially) automated
- Types of data sources: Relational, semi-structured, internal and external data sources
- Data Governance: Is an integral part of the system architecture
- Degree of use of BI: Data is used company-wide
- Notation standardization: Design based on notation standard (e.g. IBCS)
- Distribution: Data products can be consumed independently by users
- Advanced Analytics: Forecasting and optimization models are in use
Based on these dimensions, a procedure was developed that should allow our customers to implement BI modernization as efficiently and transparently as possible.
With the 5-STEP approach to a modern data factory
The goal of the 5-STEP approach is to keep the time-to-value for users as small as possible. The first results should be able to be used accordingly quickly and users should be empowered to make data-driven decisions. The transformation should have a sustainable character and the customer should actively participate in it and be enabled to operate the data production lines and ultimately the entire data factory themselves.
About IT-Logix AG
We let your data speak!
We focus on the transformation of data into information and knowledge in order to strengthen your competitiveness.
Starting with implementable BI strategy and organizational consulting, we accompany you with the BI-specific requirements analysis and the development of a sustainable architecture. No matter whether for a classic or a modern data warehouse including Big Data and Internet of Things (IoT). The subsequent integration of the data provides the basis for further support in the areas of data analysis and visualization.
Our projects are carried out according to agile principles, which means we achieve a quick and high-quality implementation of our solutions. We use carefully selected methods and technologies for this purpose. After successful implementation, we accompany you with training, maintenance and support so that the added value created is sustainably secured.
-
Whitepaper_BI-Modernisierung.pdf [290 KB
CHALLENGE
Adaptable controlling solution for growing companies
The controllers at Henkell Freixenet have many years of experience with Jedox; The software was introduced into the company in 2012 and central controlling has constantly modernized the application and established it as a group-wide platform for planning and reporting. And even after the Henkell Freixenet merger, the scope of applications will continue to be expanded.
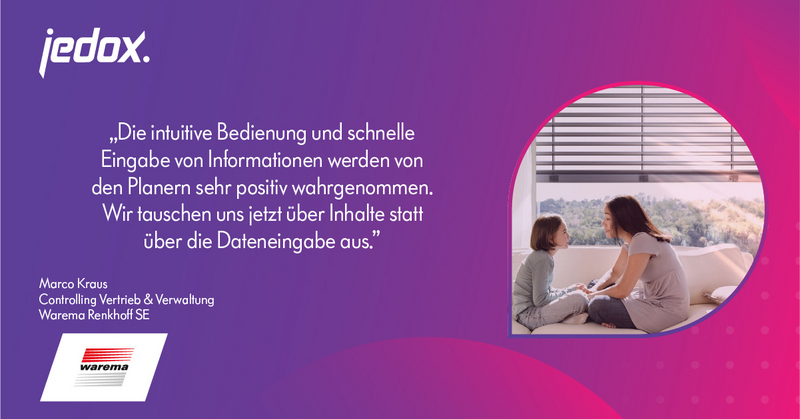
During the initial implementation, the goal was to support the group consolidation of the management results with a suitable tool and to replace Excel. Over the years, more and more departments used Jedox for planning and reporting. An important milestone was the establishment of self-service options with easy access to the fully automatically updated daily invoice via Jedox Web.
Since joining Jedox Cloud at the end of 2022, there have been new opportunities for innovative applications. The Controlling International department is currently primarily exploring the further development of predictive forecasting and driver-based planning using Jedox AIssisted™ Planning.
SOLUTION
Reporting and planning for a wide range of topics and expert areas
With the move to the cloud, the number of active users has increased to over 150 worldwide. Six departments currently use Jedox for a wide variety of topics: from sales and rolling demand planning, predictive forecasting, fixed cost controlling, technical reports, brand reporting and market data analysis to group consolidation, IC publication and a pricing database.
Dashboarding instead of rigid PDF reports
In international controlling, the focus is primarily on management reporting. Management currently receives a PDF report consisting of approximately 120 pages twice a month, which summarizes the paragraphs by region and brand. The PDF version is static and at first glance does not allow any statements to be made about action-relevant KPIs such as drivers.
Using Jedox Canvas, the project manager built a prototype dashboard that summarizes the diverse sales information in a screen window with dynamic filters. Using the canvas functions, a variety of content and visualizations can be arranged side by side using drag-and-drop and the most important KPIs can be easily pinned to the report. The development of the global icons, deviations or individual drivers in the portfolio can now be seen at first glance in the dashboard, and management can create any additional detailed views, e.g., you can drill down by region, business unit, brand, brand subgroup or product group.
Simulation, predictive forecasting and driver-based planning
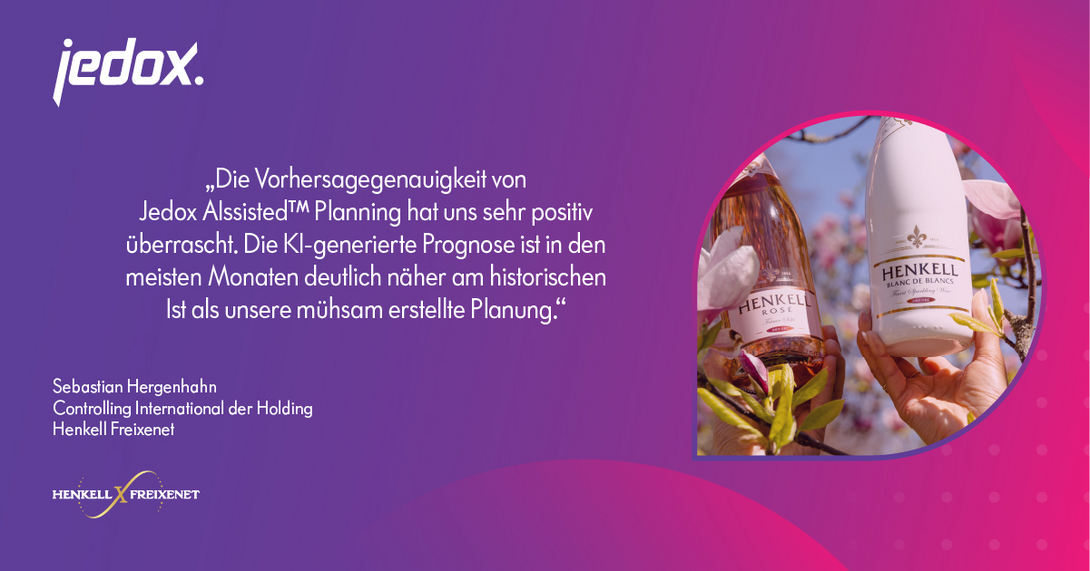
Using AI-supported forecasts from Jedox AIssisted™ Planning, controlling is currently checking whether the planning quality can be further increased with a view to the group result. Simulations also help to identify key drivers of business development and integrate them into planning.
When comparing the historical actual and planned values from previous years with the forecasts that the Jedox AI model generates on this basis, the automated algorithm performed significantly better than the laboriously created traditional planning, with a forecast accuracy of almost 91 percent. This was achieved in the first step based on key figures from just four years - as the database grows, the AI module can be expected to be more and more accurate.
OUTCOME
Scalable and investment-safe analysis platform
With Jedox, Henkell Freixenet has created a stable and expandable platform for planning and performance management, which has grown steadily with the successful company in over ten years of use. A key advantage for the experienced controllers is that they can further develop their application independently and roll it out within the group as required.
For example, in the latest expansion stage, the department responsible for management reporting created the sales dashboard without the need for consultants, which is able to replace the comprehensive PDF report. The dashboard offers faster and better insights as well as more analysis options.
The department also has data management under control and is continuously automated, from direct Excel uploads to a self-developed upload center and direct access to the source systems via the SAP connector. Among other things, this has made the work in investment controlling much easier and has meant that the responsible team can concentrate more on analyzing the data on reporting days instead of uploading it. And with better data quality and fewer coordination loops: Companies can not only provide the data more easily in self-service, but can also more easily validate and release it internally in advance in the upload center. This increases the companies' process commitment and ownership of their numbers, and saves over 175 person-days of non-value-adding work steps every year.
In addition, global access with live reporting status enables seamless, global collaboration by eliminating time zone-related downtime and sometimes nerve-wracking, short-term adjustments. Henkell Freixenet will continuously expand the Jedox platform. An important goal is the further development of driver-based planning using AI-generated suggested values. By simulating and verifying possible drivers, the planning of management-relevant KPIs should be further automated and made more precise. The team also wants to further optimize the visualization - and, above all, make better use of Jedox's great strength as a planning tool.
About Jedox
Jedox is the world's most adaptable business planning and performance management platform, enabling companies to create business plans that help companies exceed their previous results and expectations. More than 2,500 companies in 140 countries trust Jedox to model any scenario, integrate data from a variety of sources, and simplify planning across companies and systems. Jedox creates an environment in which users work better together, respond faster to changes, make informed decisions and realize previously unrecognized opportunities. Independent analysts regularly recognize Jedox for its expertise in planning and budgeting, automated reporting and analysis.

“Until recently, annual planning took two months of work and involved entire teams. We are talking about an enormous number of working hours and the main problem: the error rate. Today, K4 Analytics can resolve the issue within hours.”
MARTIN ČEVELA, BUSINESS INTELLIGENCE ANALYST AT ESET
The customer
ESET is one of the world's largest manufacturers of security software and is one of the pioneers of virus protection. The company develops award-winning threat detection software for customers in more than 200 countries.
ESET – the challenge
- Financial and human resources planning, consolidating financial plans across the company
- Automated consolidation of plans and results
- Management of deviations
- Increase planning efficiency (top-down and bottom-up, re-forecasting, time saving)
- Versioning of plans
- Workflow
The solution
With K4, your requirements for a modern planning process can be solved with manageable effort:
“Under normal circumstances the process would take a very long time and cause a lot of stress. Working with Excel requires constant concentration, which can be overwhelming, especially in stressful situations, and can easily lead to failure. Additionally, the company is wasting money because employees are doing something they shouldn't be doing. They are demotivated and discouraged, and there is also a huge margin for error,” reports Martin Čevela.
Due to the positive experience with K4 Analytics, ESET has expanded its use from the finance department to sales. Sales teams can now improve collaboration with their partner networks and, for example, distribute their marketing budgets more efficiently depending on their performance.
The sales department now uses K4 instead of MS Excel® to deliver data to the finance department and K4 takes over a large part of the planning. Sales employees are given a tool with which they can continuously monitor their set goals. This means that retailers know immediately and at all times where they stand, whether they have to work more or whether they can look forward to a surcharge.
The use
K4 Analytics is particularly beneficial for ESET employees at lower management levels because they do not have to spend a lot of time recalculating costs due to a change from above. Now you can select an item to reduce the budget for and the changes will immediately be reflected in other parts of the plan. The procedure described above completely avoids the tedious management process, which also includes Excel files sent via e-mail, which must (additionally) be provided in a user-friendly format. This means less time wasted.
“Fewer errors and less time spent on Excel means that employees can work on something meaningful. They can save up to twenty days per month and invest the time in strategy, resulting in real added value,” concludes Martin Čevela.
About K4 Analytics
K4 Analytics extends leading analytics/BI platforms such as Power BI®, Tableau®, Qlik® and collaboration platforms such as Microsoft Teams® with extensive data entry and planning functions.
Close your process gaps to create a holistic and integrated environment for your data-based corporate management.
Simply use your existing data model. From simple data capture to complete corporate performance management (CPM) applications - including workflows and comprehensive commenting functions. Use what you need right now, whether focused or integrated - from data collection to xP&A, FP&A, HR planning with versioning and corresponding scenarios.
K4 Analytics is a unique no-code environment and the only multi-platform solution. It connects existing things, is database-independent and can be implemented flexibly, quickly and precisely thanks to the proven spreadsheet approach.
Increase your efficiency! Very often, the tasks in the CPM environment are depicted using e-mail and attached spreadsheets. With K4 you transform these processes into stable and understandable processes, e.g. for ESG reporting, monthly/annual financial statements, personnel-related surveys, etc.
In a world in which there is no doubt about the enormous value of data and in which data-driven companies gain significant competitive advantages, controlling as an organizational unit must emancipate itself and reinvent itself to a certain extent. This is all the more true because not only are there incredible amounts of data available, but also technologies that open up unprecedented possibilities.
Integrated corporate management: xP&A as modern controlling
Companies have been using key figures to systematically guide their development towards success for over 100 years - the DuPont scheme, which the chemical company DuPont, which gave it its name, introduced in 1919, is perhaps the best-known example. As an organizational unit, controlling takes on an indispensable cross-sectional function for management and all departments and provides orientation with its reports. As a rule, companies are aware of the importance of their controlling. And yet your own self-image is rather defensive and the assessment from other departments is often not particularly positive.
Extended Planning and Analysis: Looking at the big picture
Apart from the fact that controlling should finally receive the appreciation it deserves - in a world in which there is no doubt about the enormous value of data and in which data-driven companies gain significant competitive advantages, controlling must emancipate itself as an organizational unit and reinvent it to some extent. This is all the more true because not only are there incredible amounts of data available, but also technologies that open up unprecedented possibilities.
The Financial Planning and Analysis (FP&A) approach can be seen as a first step in this direction, which goes well beyond traditional reporting. For example, the FP&A approach not only generates historical key figures, but also creates forecasts and simulations. But controlling can go far beyond that: if it does not focus on monetary variables, but rather acts holistically. FP&A then becomes Extended Planning and Analysis, or xP&A for short. The x stands for all aspects that go beyond finances.
Interdisciplinary connections
In concrete terms, this means: Controlling also includes the data that other departments collect - for example, purchasing on the performance of suppliers, production on the performance of the machines and systems on the shop floor or sales on the willingness of customers to buy. The highlight: Controlling does not look at the data from the specialist departments in isolation, but analyzes it holistically. In this way, dependencies can be identified that would never have been noticed from the perspective of a single department, and integrated corporate management becomes possible. For example, through the comprehensive evaluation, controlling could determine that falling purchase prices correlate with falling sales figures for a particular product. If experience data (e.g. opinions from customers) are available in addition to operational data, the reason for this connection may also become clear. In this case, perhaps customers no longer find the product as attractive because a component appears to be less valuable.
Interlinking with management and specialist departments
With such a comprehensive view, controlling can suggest optimization that benefits the company as a whole. When correlating falling purchase prices and falling sales figures, one of the things that needs to be clarified is in which scenario the company achieves the highest profit. It is also exciting to find out to what extent lower quality leads to a loss of image and what that means for future profits. At this point it becomes clear how closely controlling and management are linked in the xP&A approach. Controlling provides the facts, management makes the decisions.
The xP&A approach also promotes cooperation between controlling and specialist departments. Controlling supports the individual departments in formulating coordinated goals that do not contradict each other and all contribute to the company's goals. Controlling takes on an advisory position that respects the autonomy and competence of the individual departments in evaluations and at the same time provides visible added value for everyone.
Technology and organization: successfully introducing xP&A
If you want to implement an xP&A approach, you should look at two dimensions of an overall concept: On the one hand, there is the technology. What is required is a platform on which all data can be brought together and processed - on which a single source of truth is created. Tools are also needed that support the analysis of the data (using different methods) and the visualization of the results (for different roles). In practice, establishing a suitable technological setup is usually the easier part.
On the other hand, changes must take place within the organization, whereby massive forces of inertia almost always have to be overcome. It is important to realign the competencies and responsibilities of controlling and to establish controlling as a strategic partner for evidence-based decisions. This means that changes must also be made to management and specialist departments. And this is where things often get stuck.
In order to develop an overall concept that encompasses the technological and organizational dimensions, sensitivity and practical experience are required. An external partner like NTT Data Business Solutions offers both.
Webinar recording: Building an integrated corporate management system (in cooperation with the ICV)
Implementing successful application scenarios with processes, innovative concepts and best practices. In our lecture we will show you the current methods and technologies for operational, tactical and strategic decision-making and give you an outlook on the working world of the future and THE top trends in controlling. Here we will focus in particular on the “xP&A” controlling approach as the foundation for integrated corporate management. Managament tasks across the entire company can be connected and synchronized. We also present examples of architecture, functionality and key benefits for business users and IT.
About NTT DATA Business Solutions
We Transform. SAP® Solutions into Value
We understand our customers’ businesses and know how to lead companies successfully into the future. At NTT DATA Business Solutions, we drive innovation: From consulting and implementation to managed services and beyond, we continually improve SAP solutions and technologies so that they work for companies – and their employees.
You can use our services in over 30 countries and over our thirty years of existence we have helped thousands of companies become even more efficient and productive. Our more than 13,500 employees operate globally and will accompany you on your path to an Intelligent Enterprise – wherever you want to start!


Karl-Heinz Possinke, Global Governance Function of Transfer Pricing Management, Robert Bosch GmbH:
“BOSCH introduced the Optravis TP management tool in a business unit in 2019. The positive experiences led to the decision to introduce Optravis worldwide in the BOSCH Group in 2020. In the meantime, further functionalities were designed and introduced as part of further implementation in order to achieve a consistent digital end-to-end solution in the TP management process with Optravis. From the experience of the individual project phases as well as various roll-out and go-live phases, the high flexibility and speed of the Optravis TP management tool is particularly noteworthy. The high level of automation, the intelligence and competence of the logic and rules present in the system are essential guarantees for an effective and efficient tool solution. The service and advice from the entire Optravis team is also unique. A corresponding team of experts with a high level of competence is available to provide active advice and support on all questions at any time. With the Optravis TP Management Tool, an essential component in our internal TAX risk management system is achieved in the BOSCH Group in order to sustainably ensure TAX compliance in the transfer pricing area at BOSCH. All of this confirms our decision in favor of the Optravis TP management tool and shows again and again the high and, for me personally, unique competence of Optravis in the OTP market.”
Lucie Winklerová, Head of Transfer Pricing, Clariant International AG:
“In 2013, we automated our operational transfer pricing process by replacing all manual processes, TP negotiations via e-mail and multiple Excel files with the TP management tool, which is now part of Optravis. With this digital solution, we were able to streamline our global operational transfer pricing process, integrate it with SAP, and achieve global consistency and transparency in transfer pricing methodologies. Finally, automated P&L segmentation provides us with visibility into margins throughout the year and allows us to manage transfer pricing taking into account forecasts and business insights to achieve TP compliant results. In addition to the OTP process, Optravis' strengths lie in their expertise in the areas of controlling processes, supply chain and TP models, which allow them to adapt the solution to our needs. We are very happy that we can cover complex topics and industry-specific questions in the tool, such as: e.g. the double R method, distribution hubs, recipes, batches, differences between IFRS and local GAAP, etc. We really appreciate the ongoing TP support from Optravis, which is truly first class.”
Dr. Martin Lagarden MBA, Global Head of Transfer Pricing, Henkel KGaA:
“We have been using the Optravis TP Management Tool since 2017 and continue to be impressed by the level of automation achieved, the outstanding ex-ante pricing features and the impeccable level of service that the entire Optravis team consistently provides. This TP solution works smoothly with our SAP R3 and S4/HANA system. We now have full visibility into our IC transactions at the individual material level, allowing us to make the right management decisions. We feel very comfortable with Optravis and continue to count on the Optravis team as our long-term TP automation partner of choice. This is because their roadmap covers all TP automation areas that are relevant for us to improve and exceed TP compliance and management in the future.”
Angelika Hoffart, Global Head of Operational Transfer Pricing, Merck KGaA:
“Manual processes, growing intercompany sales with complex supply chains using different ERP systems and increasing transfer pricing requirements had triggered our need for an ERP-independent OTP technology. The sophisticated Optravis OTP solution, which takes into account industry best practices and meets our specific customer requirements, impressed in the selection process thanks to its experienced implementation partners and high service orientation. The solution has fully met Merck’s key objectives of ensuring visibility of global intercompany flows, creating fully transparent P&L segmentation and enabling process automation for transfer pricing control leading to organizational efficiencies.”
About Optravis
Optravis is the leading provider of SaaS solutions for automating operational transfer pricing processes for goods, licenses and services. Our team consists of in-house TP experts with experience in the areas of TP, ERP and controlling. We combine this knowledge with high-end technology and first-class service. Financial professionals in more than 100 countries have trusted Optravis for many years.
Our TP management tool allows you to calculate TP's in complex supply chains, highly automated, taking into account TP methods, customs duties, anti-dumping rules, etc. We use an automated forecast at the product level to determine ex-ante pricing or make product-based year-end adjustments. We adapt the application to your needs within a few months with limited IT resources.
Our newest product is the Service Charge Tool: data-driven (cost-to-invoice) and compliance-driven (pricing, documentation and defense) end-to-end service charging.


“Due to the strong growth of SENEC, we have decided to introduce a modern data stack based on Microsoft Azure in order to keep pace with increasing reporting and analysis requirements.”
Armin Geisler, Team Lead Data and Analytics, SENEC GmbH
SENEC is one of the leading solar power storage providers in Germany. Together with QUNIS, the company has set up a data lakehouse using a variety of technologies that accommodates the company's rapid growth and supports BI and IoT analyzes in a central data platform.
One platform for all data products
With the support of QUNIS, the company SENEC has set up a central data & analytics platform for all data products in the company. As a modern data stack, the cloud-based platform consists of a variety of technologies and tools for collecting, storing, processing and analyzing data. The IT architecture is a data lakehouse based on Azure Databricks, which combines elements of a data warehouse with a data lake in the central platform. The data platform supports both classic business analyzes in finance and departmental controlling as well as big data analyzes and enables the joint evaluation of all data formats in dashboards for corporate management.
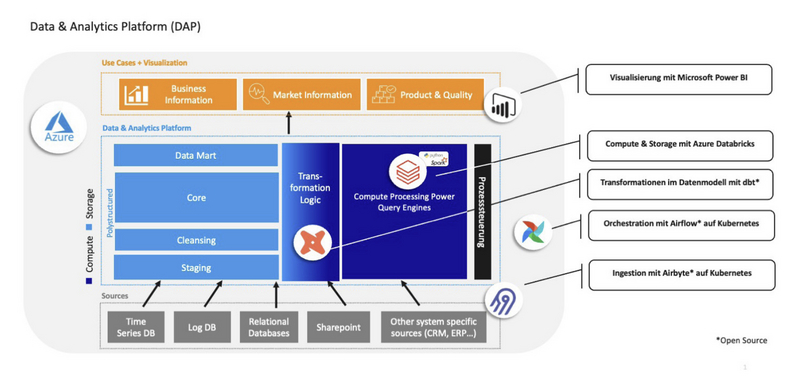
Quick conception and implementation
SENEC needed to take action due to its exponential company growth. The existing BI system could no longer keep up with the company's rapid development and the increasing demand for Big Data applications could no longer be managed with individually programmed solutions. The evaluation of streaming data from IoT products, field test analyzes based on battery data or ML applications such as predictive maintenance are among the growing number of use cases at SENEC that required a new IT environment for data & analytics.
The conception and implementation of the complex platform took place on a tight schedule. Within two months, QUNIS and SENEC defined the strategy for the new IT architecture, the system concept and topics such as data governance and security. The implementation of the IT architecture finally began in autumn 2022 - the data platform was ready for operation in March 2023.
Even during strategy development, QUNIS installed a temporary test infrastructure as a simplified version of the target system. In this way, the team was able to expand the platform using agile prototyping and, at the same time, implement the initial requirements of the departments and management.
The lakehouse architecture today integrates a wide range of data sources as a single point of truth and provides streaming analytics, business intelligence and machine learning functions in the consistent platform. With the continuous implementation of new use cases, additional data sources are gradually connected.
QUNIS Practical Report | SENEC | Data Lakehouse

About QUNIS
QUNIS masters the entire spectrum of data & analytics. From self-service BI to enterprise BI, from setting up and operating a data warehouse to modern lakehouse architectures including streaming and optimal use of the cloud. The design and implementation of clear data visualization concepts, the introduction of data governance, the setting up of an operating concept as well as the training and further education of the teams involved also play an important role. QUNIS offers its customers comprehensive expert know-how and experience poured into frameworks paired with modern project tools, best practices and proven process models. We use technologies from Microsoft and SAP, open source tools for Big Data and the services of cloud hyperscalers. We support our customers from the development of a strategy and roadmap, through implementation, to the operation of the solution and its sustainable anchoring in the organization. QUNIS has its head office in Brannenburg, Upper Bavaria, and is represented by over 20 other offices in Germany and Austria.
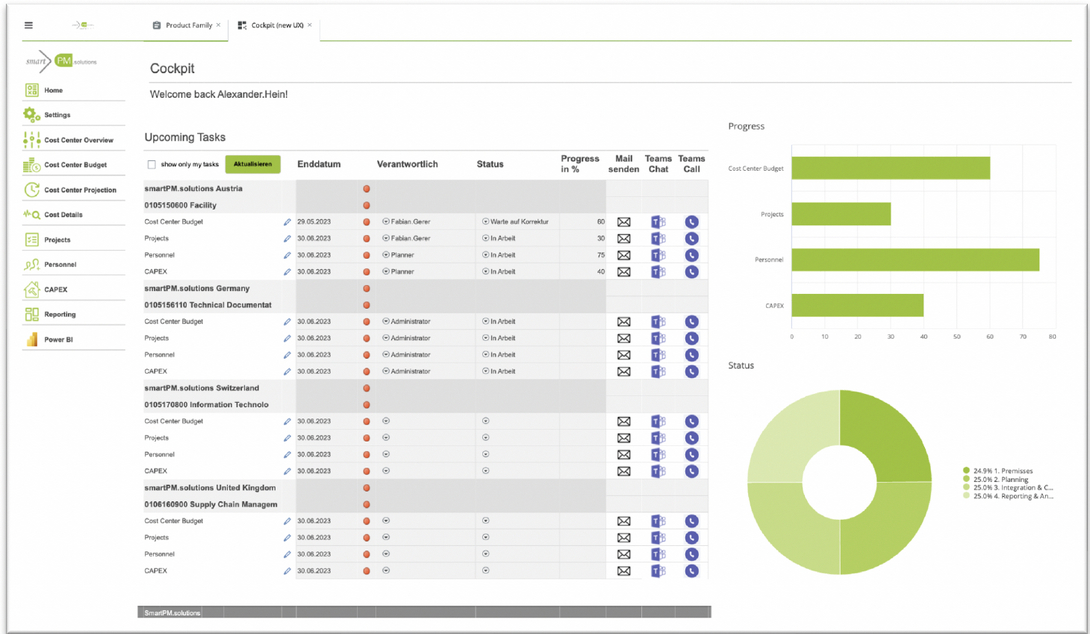
“With Excel the options were limited, now we can plan flexibly and quickly. The new planning system integrates all partial plans and will be rolled out to our branches worldwide. What we like best about it is the ability to plan continuously and issue flexible forecasts,” says Daniel Olthaus, Head of Financial Analysis and project manager for the ROSEN Group in Germany.
About the ROSEN Group
The ROSEN Group is a world-leading provider of highly developed technical solutions. Active in over 120 countries, the group implements innovative technological solutions for the inspection of industrial systems in the energy industry to ensure safe and reliable operation according to the highest standards to protect people and the environment.
Facts about ROSEN
Founded: 1981
Employees: 3.900
Headquarters: Stans, CH
“We have worked very Excel-heavy in the past. As many people know it – preparing and merging data. Some macros had opening times of over a minute, which made user handling very difficult. Overall, the planning took too long. Since introducing the system with smartPM, our planning and forecasting cycles have been massively shortened.” Daniel Olthaus, Head of Financial Analysis, ROSEN Group in Germany.
INITIAL SITUATION
Initial situation and challenges of the ROSEN Group before the start of the project:
- Time-consuming and laborious merging and maintaining large Excel sheets.
- Ensuring good data quality and data timeliness was challenging.
- Different partial plans continually led to coordination efforts. The focus was on comparing partial plans and analyzing deviations.
- The analysis was neglected and the derivation of management decisions was challenging because data interpretation was discussed instead of analyzes and recommendations for action.
- The planning cycles were long. There was a lack of flexibility and responsiveness.
- The call for a professional, integrated system with high user acceptance was loud.
Daniel Olthaus, Head of Financial Analysis:
“We planned the implementation of the fully integrated planning project in several implementation steps. We were aware that we would not have a fully developed planning system from the start and that we would not be able to use it across the group. That's why we have planned 5 stages or project phases:
- Legal planning of the German units: cost centers, project, personnel, CAPEX, investment, P&L with different planning cycles, so that we don't just plan on annual slices, as in the past, but continuously, throughout the year. The plan is continually updated and scenarios can be differentiated in the flexible system.
- Based on this, the hourly rates are derived from the planning and the balance sheet figures (intra-year development of working capital).
- Integration of legal entity planning and sales planning with order intake planning and sales and profit center planning.
- Automating the linking of subplans for a fully integrated system. A change in the subplan shows the impact on the other subplans (sales, cost planning, etc.).
- At the end there is the fully developed xP&A with a coherent picture of the future development for the entire group.”
Project goals
- A fully integrated system with connection to all data sources and networking of all sub-plans that impact financial planning (sales/sales, procurement, production, delivery/service provision) for the entire group.
- Acceleration of the budget process: Continuous planning with the ability to incorporate adjustments directly. This allows management decisions to be optimally supported.
- Improving data quality and timeliness
- Quick response to changing partial plans including adjustments during the year and flexible, easily configurable scenarios/bandwidth planning with value drivers.
- Mapping and merging different planning dimensions: sales view vs. management view of the legal units.
Daniel Olthaus, Head of Financial Analysis at ROSEN Group in Germany:
“We can now plan and make decisions continuously - with current data. The planning process is standardized. All sub-plans are linked and the need for coordination has decreased significantly. The users or user groups have their own cockpit with their own planning steps. The responsibilities are clearly assigned and the submission of partial plans is scheduled in the system. This allows the status of the planning to be monitored. Thanks to the Teams and Office integration, you can contact the planners directly. This saves a lot of time. For example, planning scenarios, cost types compared to previous year's values, etc. can also be carried out in the standardized planning masks. Value changes can be easily adjusted and distributed automatically. Deviations can also be easily identified and comments for any special effects can be entered by the planners. Planning can be done at the account level and parent level with automatic distribution.”
Project implementation
- 2022: Development of a 5-step plan: Go Live planned for 9/2023
- December 2022 to March 2023: Software selection with exact requirements lists and demo dates with 5 providers on the longlist.
- January 2023: Implementation of prototype capacity planning with ROSEN company data through smartPM, another 4 providers show their solutions
- April-May 2023: Proof of Concept with 2 providers (shortlist): Testing data model and connection, user management, dashboards, license model, support, flexibility
- May 2023: Unanimous decision for smartPM.solutions. Start implementation capacity & resource management, cost center planning, data connection
- June 2023: Implementation of financial reporting
- July/August 2023: Implementation of cash forecasting and test phase of the system, implementation check whether all requirements are met
- September 2023: Planning go-live exactly according to schedule for all planners/users
Daniel Olthaus, Head of Financial Analysis, ROSEN:
“Support was a key point in the decision for smartPM.solutions. The software for most providers is quite identical. Our focus was more on: What is the implementation team like, what is the support like and how does it work after the project. We had a good feeling that the implementation with smartPM would also be successful. This was an important point for us and is now an important factor, even after we have completed the first implementation step on time, because points keep changing during the project or implementation phase, where we notice that we can cope with it in the short term Providers must react together and adjust their priorities. Ultimately, what is crucial is that we have a partner who is as flexible as possible and with whom we can implement things quickly. So far we have made the right decision with smartPM.”
Conclusion & Learnings
- Step by step introduction is highly recommended – the proven 5-step plan
- Decisive success factors for the BI and FP&A implementation project: Not the software, which is very similar from many providers, but the support even after the project and the experience of the implementation partner.
- Massive improvement in data and decision quality by networking data and partial plans in one system. Significantly simplifying the monitoring of key financial indicators. Time savings: Fast and continuous budget planning.
- Very clear personnel planning and investment planning with planning masks per cost center. Complete reporting with very good visualization displayed in the system.
- High user acceptance, responsibilities can be adjusted centrally very easily – for entire units or functions, good user guidance with an individually definable home page – cockpit.
About smartPM.solutions
With smartPM.solutions as your trusted partner for integrated planning, analysis, budgeting, forecasting, reporting and consolidation, you will maximize your success and achieve your business goals more efficiently than ever before.
Accelerate your planning processes and gain valuable insights from all your company data.
Leading technology providers such as Jedox, MS Power BI, SAP and Unit4 FP&A (prevero) rely on smartPM.solutions to achieve the optimum from modern technology and business solutions.
Trust in smartPM, the experienced partner in implementing digitalization in controlling with an average project rating of 4.9 out of 5 stars.

By moving to CCH Tagetik on Cloud, Kelvion has reduced hardware, infrastructure and resource costs and now has seamless, stable operations. The company is better prepared for the future and can easily benefit from the latest functionalities. Thanks to CCH Tagetik Cloud, Kelvion has the potential to quickly scale and expand as the company grows.
Mark Bevan, CFO, Kelvion
The challenge
The on-premise system of Kelvion, the global specialist in heat exchangers, cooling systems and machines, urgently needed an update to take advantage of the latest features from CCH Tagetik. The operating system was 10 years old and the SQL databases were almost the same age. However, a system upgrade would have been very costly and would have required significant internal resources.
As a more efficient and forward-looking approach, CCH Tagetik suggested moving to the cloud. No one thought it would be easy: the transition from on-premises to the cloud had to be completed within tight monthly reporting deadlines for internal and external stakeholders, with limited flexibility to accommodate delays. Additionally, responsibility for the CCH Tagetik application needed to be assigned and appropriate and appropriate IT resources allocated. In addition, there was the database that had to be optimized for the new scenario.
To improve the overall performance of the system, Kelvion decided to migrate to the future-proof CCH Tagetik in-memory consolidation engine to provide an overall performance improvement through administration of the ownership structure register, the use of embedded subgroup consolidation and IFRS5 functionalities achieve. The replacement of the externally managed Excel reporting tools with the standard reporting tools from CCH Tagetik and the replacement of the existing financial planning application with CCH Tagetik Budgeting and Planning rounded off the migration to the cloud project.
The Customer
Company
Kelvion Holding GmbH
Industry
Mechanical engineering
Use of CCH Tagetik
- Enterprise Cloud Budgeting and planning
- Consolidated financial reports (actual, forecast and budget)
- Management reporting
- Disclosure management
- ETL (data extraction, transformation and loading)
Key data
- 5,000 employees worldwide
- Sales approx. 1 billion EUR
- Products and services: heat exchangers, cooling systems and engines
- Markets: Energy, Oil & Gas, Food & Beverage, HVAC, Data Centers, Chemicals, Heavy Industry, Marine, Refrigeration, Sugar, Transportation
The Goals
Kelvion's goal was an easy-to-update and secure solution that would benefit from the latest functionalities of the CCH Tagetik software and cover the following areas: consolidated financial statements (actual, forecast and budget), management reporting (at group and subgroup level), disclosure management as well extraction, transformation and loading (ETL) of the data.
Requirements
- Smooth transition from an on-premise to a cloud-based solution, with support during the transition phase
- Seamless continuity in the use of CCH Tagetik after migration to the cloud
- Improving overall performance
- Smooth transition from standard to in-memory consolidation engine
- Use of the ownership register, consolidation of subgroups and IFRS5
- Replacement of externally managed Excel reporting tools with CCH Tagetik standard reporting
- Ongoing support of CCH Tagetik software
- Future upgrade options
Benefits and results
- Lower TCO
- Secure and easily upgradable solution
- 99.5% guaranteed availability
- 24/7 monitoring & support
The Solution
CCH Tagetik was chosen for consolidation, budgeting and planning, financial and management reporting, and disclosure on cloud.
Starting in 2021, Kelvion, together with its partner for strategic performance management and transformation, Horváth & Partner GmbH, conducted an analysis of the existing financial information systems to determine the strengths and weaknesses.
In 2022, Kelvion CCH invited Tagetik to conduct a Health Check of the existing on-premise solution. This detailed audit, which also covered IT and business functions, was the basis on which the CFO decided to migrate to CCH Tagetik on Cloud on Microsoft SQL Server.
As the second part of the Health Check, CCH Tagetik provided the customer with a wide range of options to prepare the solution for future requirements. Together with Kelvion and Horváth & Partner, CCH Tagetik started the conception phase for the migration, the functional expansions as well as the stabilization and performance increase of the specified financial information system. In the end, the customer decided not only to migrate their CCH Tagetik solution from on-premise to the cloud, but also to expand the existing financial consolidation capabilities. Improvements were achieved by switching from a standard to an in-memory consolidation engine, using the predefined functionalities from the ownership register and activating the IFRS5 functionalities. Kelvion also decided to replace its existing financial planning solution with CCH Tagetik budgeting and planning and its Excel-based management reporting system with CCH Tagetik standard reporting tools. Kelvion, Horváth & Partner and CCH Tagetik jointly developed the concept for migration to the cloud.
Just one week after the contract was signed, the CCH Tagetik Cloud team provided the customer with its new cloud-based CCH Tagetik solution with two environments for production and test (with integrated master data management between the different environments). There is a single sign-on functionality and the proven CCH Tagetik Cloud Data Loader for data transactions between the CCH Tagetik Cloud environment and all external environments: for Kelvion, for example, the connection to a private cloud-based Microsoft Azure database in order to relevant extract data in CCH Tagetik Cloud and deliver it to the external source. The Data Loader also facilitates the migration of data from the on-premise solution to CCH Tagetik on Cloud.
Thanks to CCH Tagetik Cloud, Kelvion has the ability to quickly scale and expand as the company grows.
The CCH Tagetik Services team performed the migration of the on-premise solution to the cloud solution, and CCH Tagetik's certified partner, Pfefferkorn Consulting GmbH, completed the switch from standard to in-memory consolidation. This enabled a seamless transition without impacting ongoing month-to-month closing and stabilized the closing process by integrating the ownership register and activating IFRS5 functionalities.
Kelvion completed the successful migration to the CCH Tagetik cloud-based solution with CCH Tagetik Budgeting and Planning replacing the existing OneStream financial planning application and CCH Tagetik Standard reporting replacing the existing Excel reporting.
By switching to CCH Tagetik on Cloud, Kelvion has reduced its hardware, infrastructure and resource costs and has seamless, stable operations.
Results and benefits
According to CFO Mark Bevan, by switching to CCH Tagetik on Cloud, Kelvion has reduced hardware, infrastructure and resource costs and now has seamless, stable operations. The company is better prepared for the future and can easily benefit from the latest functionalities. Thanks to CCH Tagetik Cloud, Kelvion has the ability to quickly scale and expand as the company grows.
About Wolters Kluwer - CCH® Tagetik
Wolters Kluwer (EURONEXT: WKL) is a leading global provider of expertise, software solutions and services in the areas of healthcare, tax and accounting, operations, finance, corporate compliance and regulation, as well as corporate performance and ESG. We support our customers in important decisions every day by providing expert solutions that combine deep expertise with technologies and services.
Wolters Kluwer achieved annual sales of 5.6 billion euros in 2023 and serves customers in over 180 countries. Wolters Kluwer employs around 21,400 people. The headquarters are in Alphen aan den Rijn (Netherlands).
With the CCH® Tagetik Corporate Performance Management (CPM) solution, Wolters Kluwer provides a strategic and financial intelligence platform that empowers CFOs and their employees to execute their financial strategy by making faster, more informed decisions.
CCH® Tagetik streamlines financial close and consolidation, integrated business planning and regulatory compliance. The open, extensible platform connects financial and operational data with operational solutions to generate intelligence from across the organization.

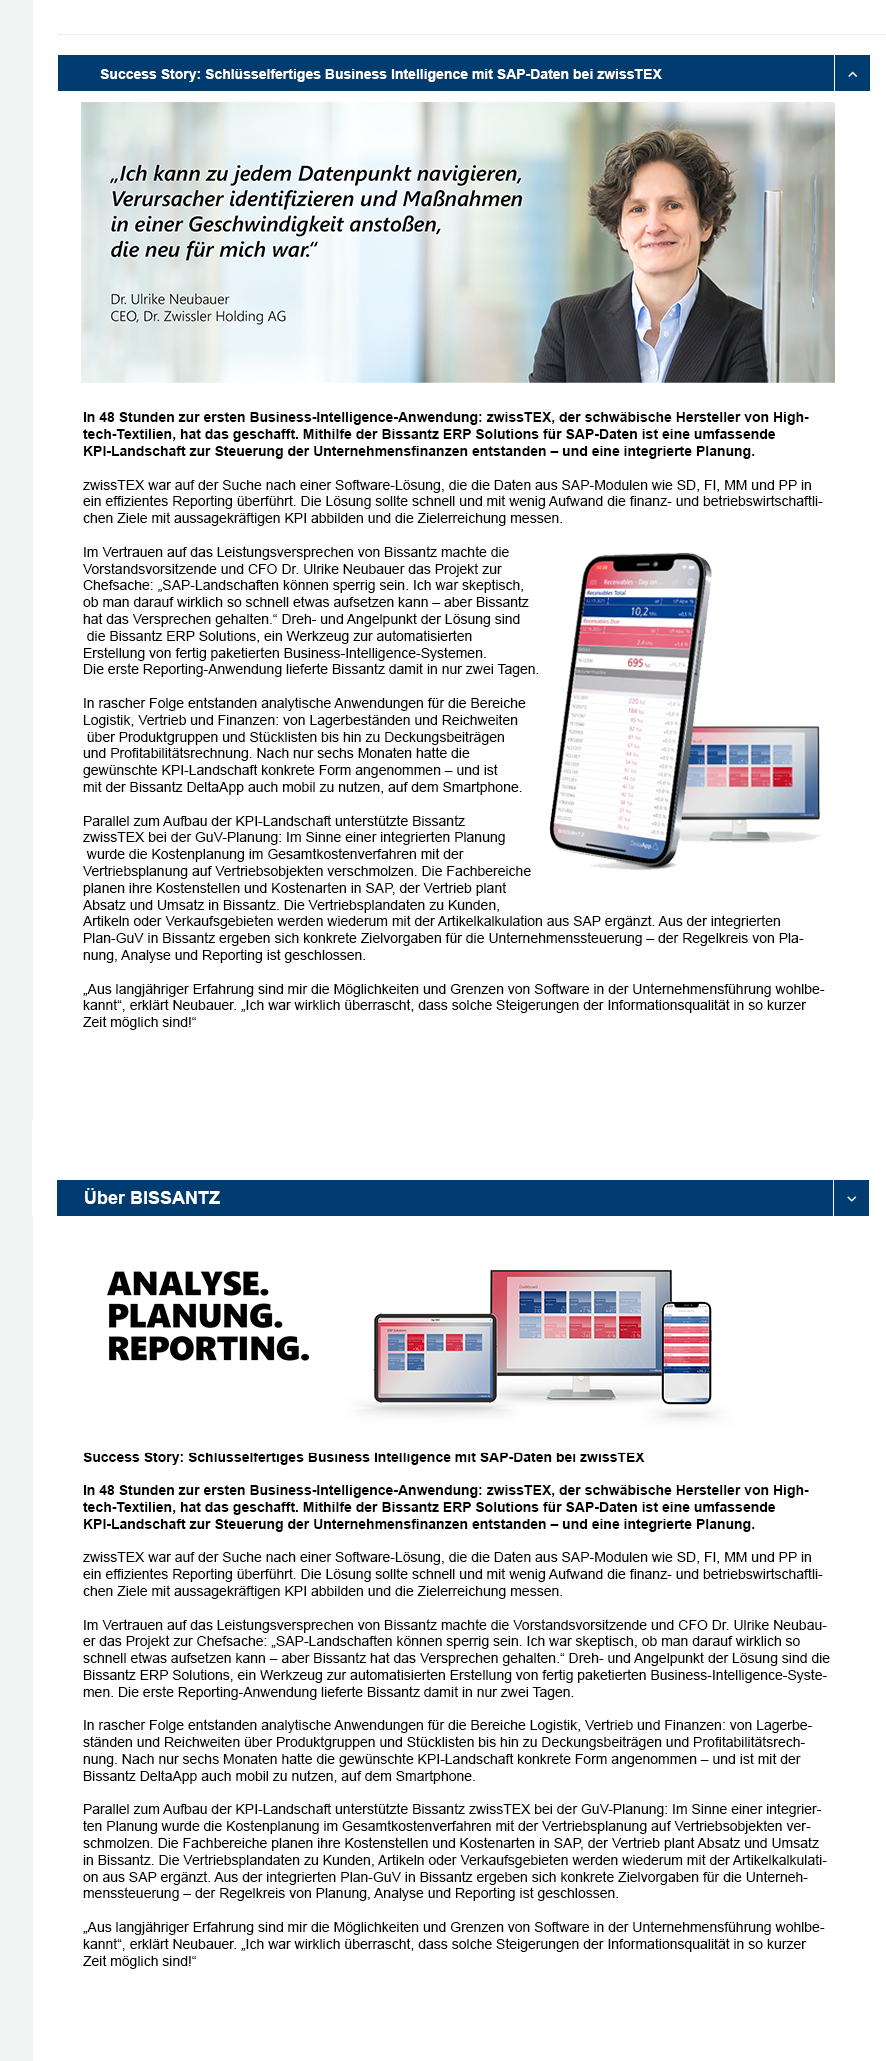